应用截图
详细介绍
Angular DevTools extends Chrome DevTools adding Angular specific debugging and profiling capabilities.
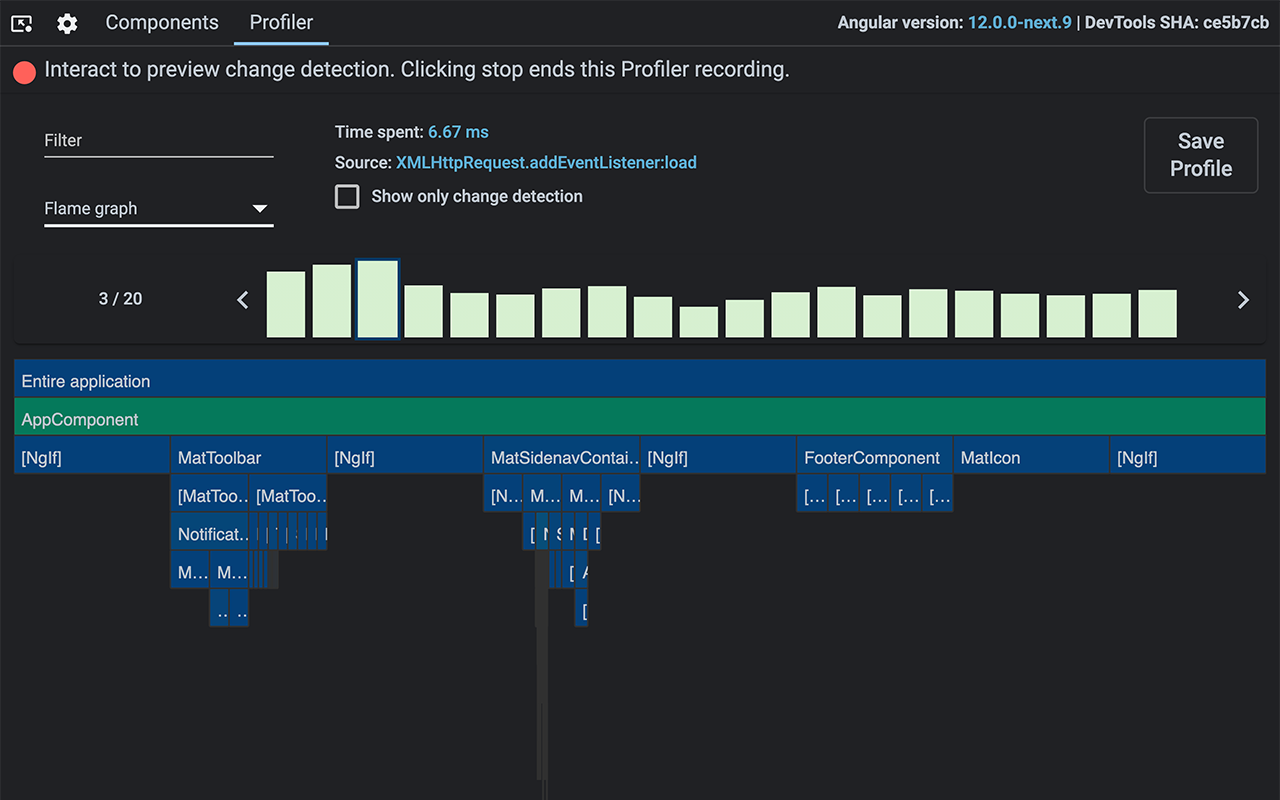
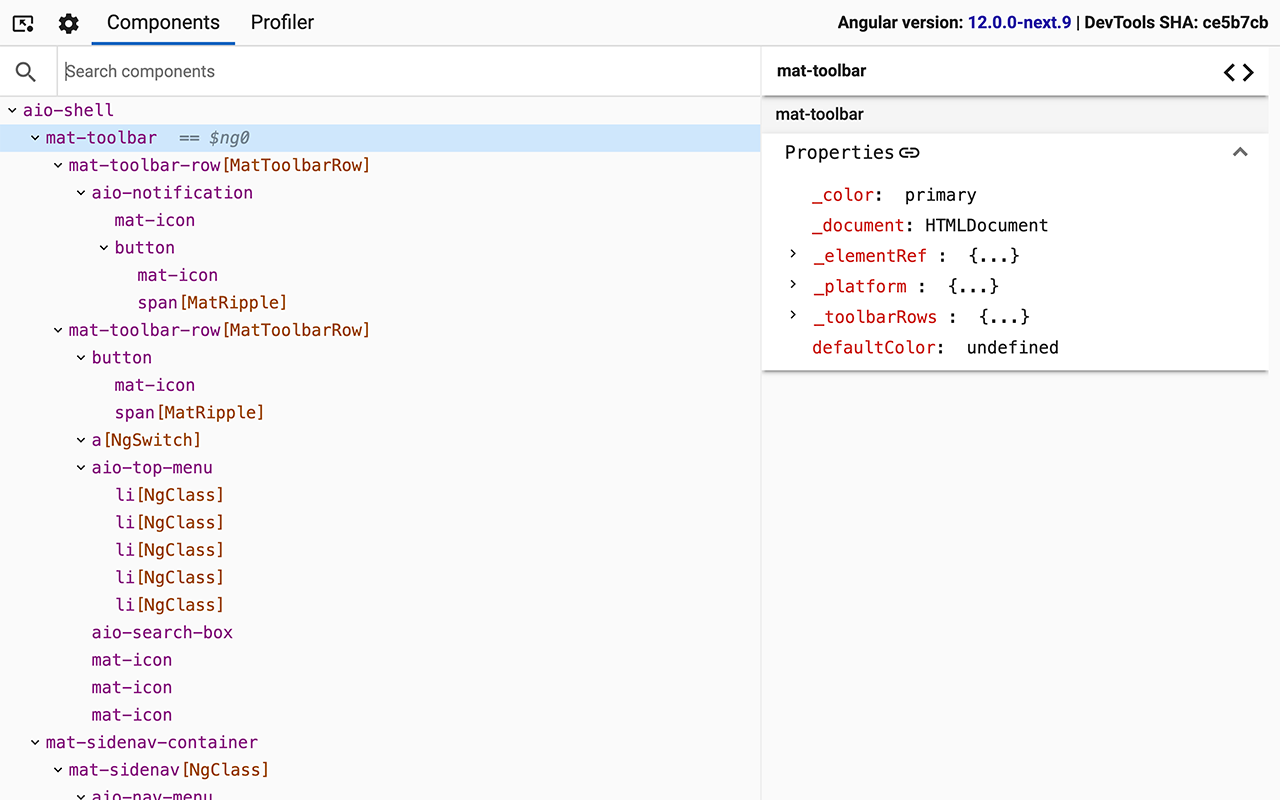
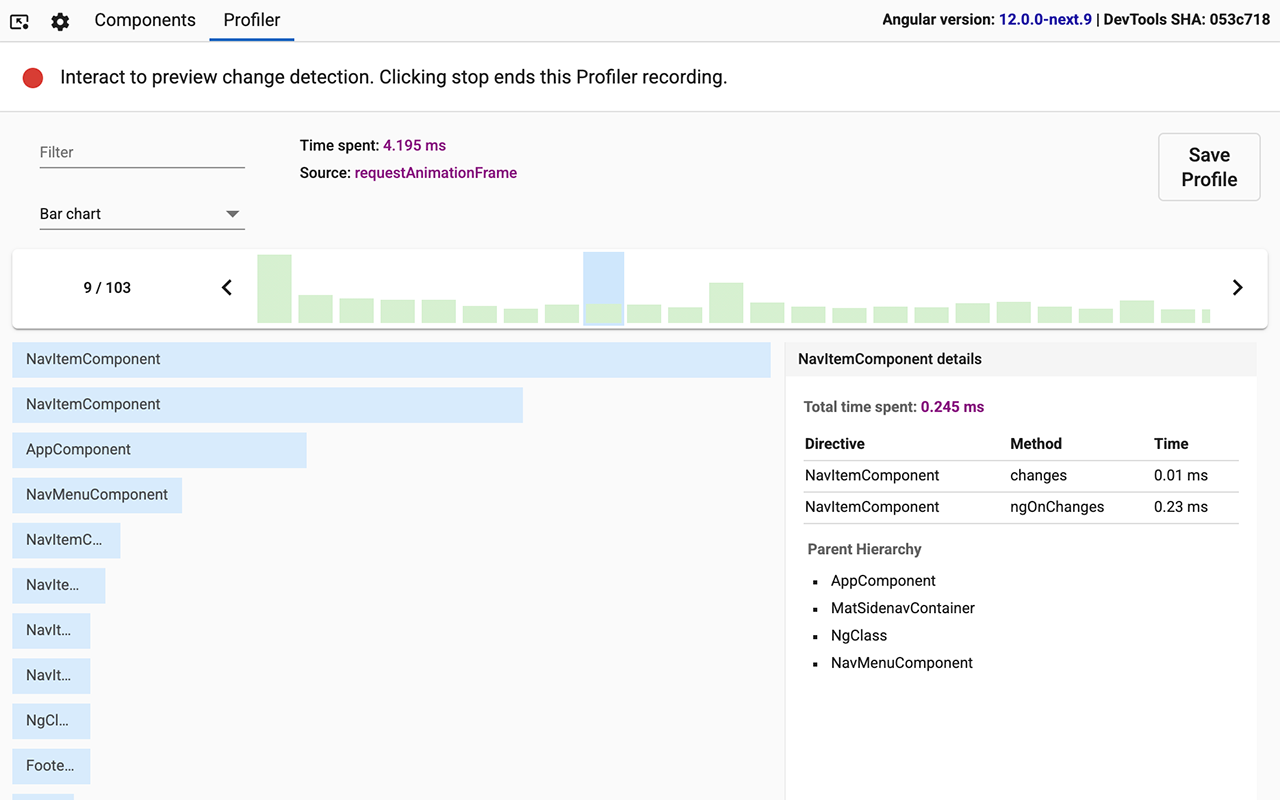
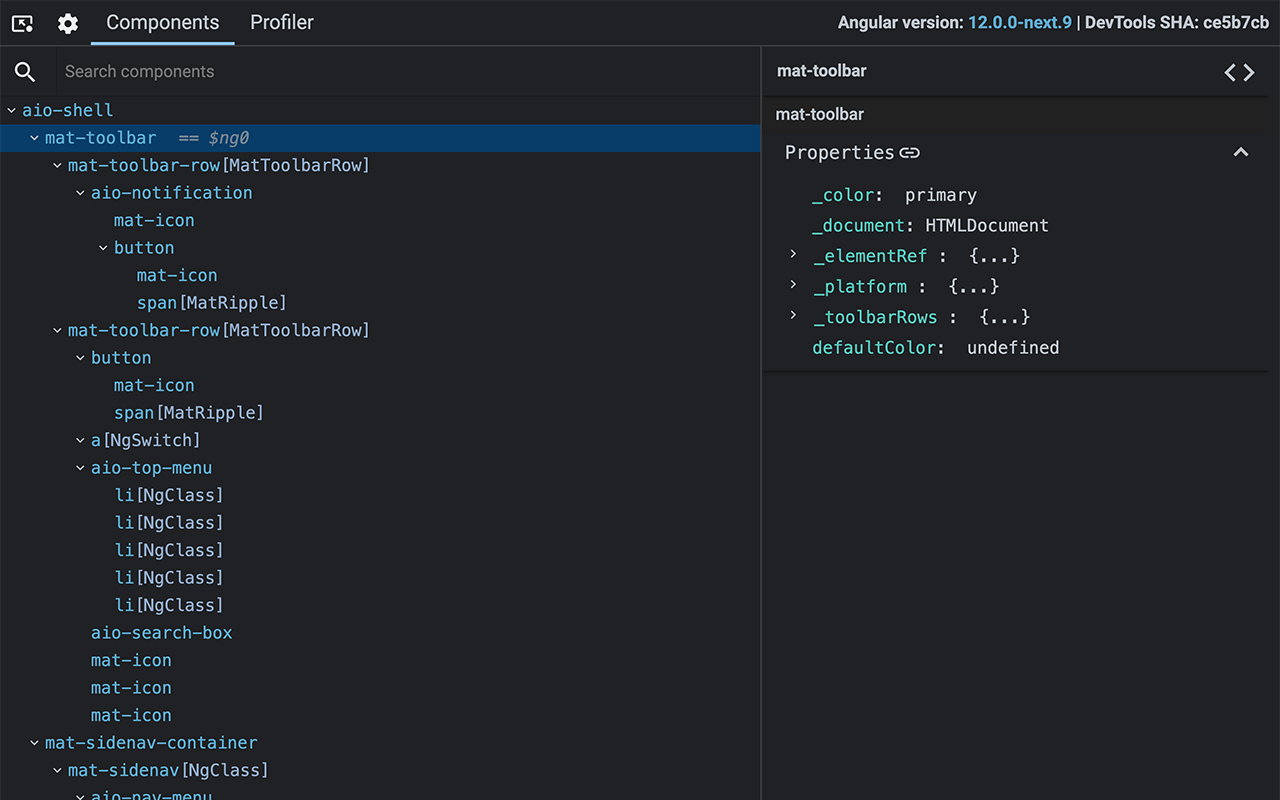
You can use Angular DevTools to understand the structure of your application and preview the state of the directive and the component instances. To get insights into the execution of the application, you can use the profiler tab, which shows you the individual change detection cycles, what triggered them, and how much time Angular spent in them. You can also inspect and visualize your application's dependency injection tree to better how understand how and why any token was resolved to a specific service.
You can use Angular DevTools to understand the structure of your application and preview the state of the directive and the component instances. To get insights into the execution of the application, you can use the profiler tab, which shows you the individual change detection cycles, what triggered them, and how much time Angular spent in them. You can also inspect and visualize your application's dependency injection tree to better how understand how and why any token was resolved to a specific service.